
Precipitation data for the upper Pine River Site "A". Observed at Lot15E Conc.2 Melancthon Township and 224 Main Street, Horning's Mills.
Data (current month incomplete)
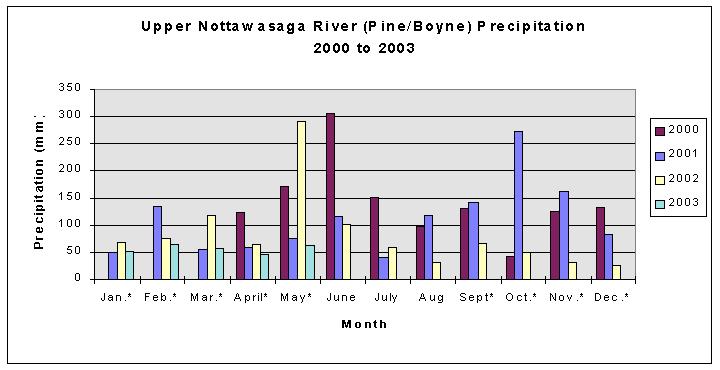
Precipitation in millimeters (rainfall equivalent).
| Year | Jan.* | Feb.* | Mar.* | Apr.* | May.* | Jun. | Jul. | Aug. | Sep.* | Oct.* | Nov.* | Dec.* |
| 2000 |
|
|
|
|
|
|
|
|
|
|
|
|
| 2001 |
|
|
|
|
|
|
|
|
|
|
|
|
| 2002 |
|
|
|
|
|
|
|
|
|
|
|
|
*indicates snowfall is included converted as 10:1
It can be seen from the above data, that the year 2000 was much wetter in the early months from April until July while 2001 had its wettest period from August to November. This lack of moisture in the first half of the year was seen in many parts of Canada, impacting crop yields and the farm economy. This also impacted upon the measured stream temperatures, as seen below, as the flow was much lower during the hottest months. In 2000, several major thunderstorms struck in June, contributing to the high readings for that month. In October 2001, a major cyclonic system contributed to the bulk of the rainfall. Much of the precipitation in 2001 was cyclonic, adding significant new moisture to the Great Lakes basin.
Annual Totals
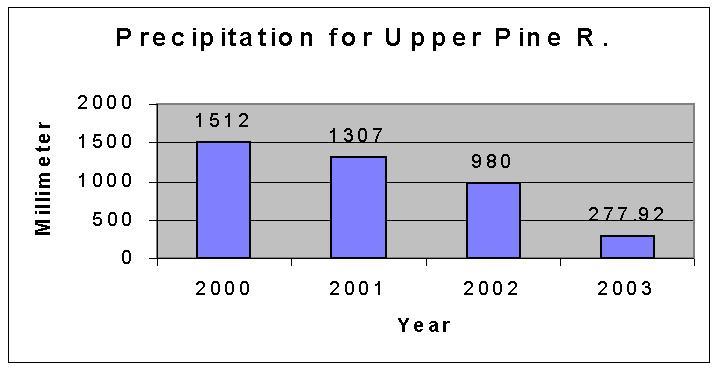
The total annual precipitation for 2000 has been adjusted to twelve months by adding the precipitation measured for January, February and March 2001. While this is not exact, it serves to give a rough comparison between the two years, with 2000 being somewhat wetter.
Temperature data for the upper Pine R Site "A". Observed at Lot15W Con.2 Melancthon
Data upon request.
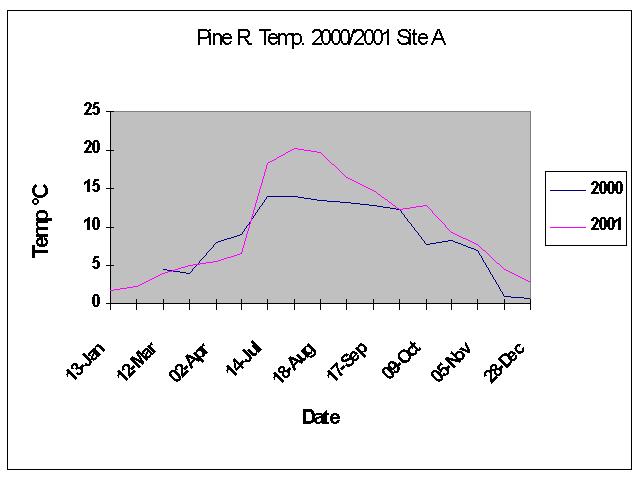
The temperature curve, for year 2000,shows an overall smooth but significant seasonal variation. This indicates that the water is shallow source. Deeper spring fed streams should show a flatter curve, resisting the seasonal variation. Spot readings (not shown in this graph) in the spring of 2000 vary greatly, reflecting the impact of several high volume rainfalls from storms. Some of these events deposited over 90 mm of precipitation in twenty-four hours. Obviously surface run off is fairly rapid and impacts the stream. This is not surprising, as over fifty percent of the watershed above the sampling point is open field. It is also notable that the average slope in the spring is more flat than in the fall. This is a result of the above average temperatures in the winter of 1999-2000 and the more rapid cooling we experienced in the fall of 2000. Another indication of this is seen in the March readings of around 4°. C while the end of year readings were already down to near 1°. C. Hopefully the tracking of this stream during 2001 will add more strength to these conclusions.
2001 data has the same seasonal characteristic
as the 2000 data, but the higher peak temperature in mid-summer reveals
the much lower precipitation experienced. This was a generally warmer,
drier year and the stream flows were low and not too variable. Since
there were no cloud burst thundershowers in 2001, there were no sudden
surges in stream flow.
The temperatures began to rise in January and
the year ended with much warmer water in the stream. Even so, small
sized trout were seen all year long with frogs present during the warm
months.
I have begun a detailed study of the approximately
9 km2 of drainage basin
that drains through this monitoring point. The progress of this effort
can be followed on related pages.